[astropark] Trend Skywalker V2 [strategy]Dear Followers,
today I'm glad to present you Trend Skywalker V2 , the evolution of Trend Skywalker V1 indicator that you can see here below:
This indicator works on every timeframe and market, it's quite responsive to market movements, so it's especially good on volatile markets.
In this new version you have 3 trend clouds available :
a short-term one (yellow)
a mid-term one (green)
a long-term one (blue)
You can also enable an option to show all trend clouds as one, the result will be similar to a special bollinger bands tool.
Of course you can edit trend clouds analysis period and color, also you can turn on or off the cloud that you prefer.
The indicator can run 4 different kinds of strategy : one for each trend cloud individually or a mixed one.
Also the indicator tracks for you a peak profit from entry: this tracker is a suggestion for you to take profits while price goes up!
All red-green circles you see in the chart is a reminder that a peak profit label was there in the past: what does this tell you?
if price starts losing the short-term trend and you had a lot of TP suggestions, maybe trend ended and you should start consider closing your trade before you give back all your profit.
On backtesting you can you test long and short setups individually or both, as well as performance in a specific time window.
This is a premium indicator , so send me a private message in order to get access to this script.
Cerca negli script per "take profit"

SQZ Multiframe StrategyThis is a first attempt to automate what my current strategy when trading is.
It uses 2 timeframes: the one you are currently using to see the chart and an "anchor trend" which is a higher order frame.
Supported timeframes are: 1m, 5m, 15m, 30m, 1H, 4H, 1D, 1W
The Strategy relies on two indicators:
Squeeze Momentum Indicator
CMF
How does it works?
It looks for a moment when the following conditions are met.
For Long:
Positive directionality in SQZM monitor in anchor timeframe
Positive directionality in SQZM monitor in current timeframe
Recent minimum in CMF
For Short:
Negative directionality in SQZM monitor in anchor timeframe
Negative directionality in SQZM monitor in current timeframe
Recent maximum in CMF
After a BUY or SELL order is executed the plot will start showing two lines: A TP line, and a SL line.
The TP and SL move dynamically based on a greedy algorithm based on 3 input parameters.
Min Profit to Start Moving SL (%): Sets an initial target for the trade.
Maximum Possible of SL (%): This is the maximum amount possible for SL. If volatility is not too high, a shorter SL will be chosen based on Kaufman's Stops method
Take profit factor: Is how much portion of the target I am taking as profit once the target is reached
Example for 5% Min profit:
When the first target is reached (+5%), the SL will be updated to 2.5% over the enter price.
When the second target is reached (+10%), the SL will be updated to 5% over the enter price.
Note: The strategy might abandon the position prematurely if a contrary signal is received while the trade is opened, and will change direction.
The Strategy has been backtested mostly for crypto. It might be good for stocks too, but the parameters mentioned might need some adjustments since price moves at a different rate.
Recommended timeframe is 4H for BTC , and 30min/1H for alts.
Comments and ideas are more than welcome!

Strategy Template - V2This is an educational script created to demonstrate few basic building blocks of a trend based strategy and how to achieve different entry and exit types. My initial intention was to create a comprehensive strategy template which covers all the aspects of strategy. But, ended up creating fully fledged strategy based on trend following.
This is an enhancement on Strategy-Template But this script is comparitively more complex. Hence I decided to create new version instead of updating the existing one.
Lets dive deep.
SIMPLE COMPONENTS OF TREND FOLLOWING STRATEGY
TREND BIAS - This defines the direction of trend. Idea is not to trade against the trend direction. If the bias is bullish, look for long opportunities and if bias is bearish, look for short opportunities. Stay out of the market when the bias is neutral.
Often, trend bias is determined based on longer timeframe conditions. Example - 200 Moving Average, Higher timeframe moving averages, Higher timeframe high-lows etc. can be used for determining the trend bias.
In this script, I am using Weekly donchian channels combined with daily donchian channels to define trend bias.
Long Bias - 40 Day donchian channel sits completely in upper portion of 40 Week dochnial channel.
Short Bias - 40 Day donchian channel sits completely in lower portion of 40 Week donchian channel.
ENTRY CONDITION - Entry signals are generated only in the direction of bias. Hence, when in LongBias, we only get Long signals and when in short bias, we only get short signals.
In our case, when in Long Bias - if price hits 40 day high for the first time, this creates our long entry signal. Similarly when in Short Bias , price hitting 40 day low will create signal for going short. Since we do not take trades opposite to trend, no entry conditions are formed when price hits 40 day high in Short Bias or 40 day low in Long Bias.
EXIT CONDITION - Exit conditions are formed when we get signals of trend failure.
In our case, when in long trade, price hitting 40 day low creates exit signal. Similarly when in short trade price hitting 40 day high creates exit signal for short trade.
DIFFERENT TYPES OF ENTRY AND EXIT
In this script, I have tried to demonstrate different entry and exit types.
Entry types
Market - Enter immediately when entry signal is received. That is, in this case when price crossover over high in long bias and crosses under low in short bias
Stop - This method includes estimating at what level new highs are made and creating a stop buy order at that level. This way, we do not miss if the break out is stronger. But, susciptible to fail during fakeouts.
Limit - This method includes executing a limit order to buy at lower price or sell at higher price. In trend following methods, downside of limit order is when there is genuine breakout, these limit orders may not hit and during trend failures the limit orders are likely to hit and go straight to stop.
Stop-Limit - this is same as stop order but will also place a limit condition to avoid buying on overextended breakout or with lots of slippage.
Exit types
Market - whether to keep the existing trade running or whether to close it is determined after close of each bar and exit orders are executed manually upon receiving exit signal.
Stop - We place stop loss orders beforehand when there is a trade in place. This can help in avoiding big movements against trade within bar. But, this may also stop on false signals or fakeouts.
Take profit
Stop - No take profits are configured.
Target - 30% of the positions are closed when take profit levels are hit. Take profit levels are defined by risk reward.
USING THE CODE AS TEMPLATE
As mentioned earlier, I intended to create a fully fledged strategy template. But, ended up creating a fully fledged stratgy. However, you can take some part of this code and use it to start your own strategy. Will explain what all things can be adopted without worrying about the strategy implementation within
Strategy definition : This can be copied as is and just change the title of strategy. This defines some of the commonly used parameters of strategy which can help with close to realistic backtesting results for your coded strategy and comparison with buy and hold.
Generic Strategy Parameters : The parameter which defines controlling alllowed trade direction and trading window are present here. This again can be copied as is and variable inDateRange can be directly used in entry conditions.
Generic Methods : f_getMovingAverage and f_secureSecurity are handy and can be used as is. atr method provideded by pine gives you ATR based on RMA. If you want SMA or any other moving average based ATR, you can use the method f_getCustomAtr
Trade Statements : This section has all types of trading instructions which includes market/stop/limit/stop-limit type of entries and exits and take profit statements. You can adopt the type of entry you are interested in and change when condition to suit your strategy.
Trade conditions and levels : This section is required. But, cannot be copied. All the trade logic goes here which also sets parameters which are used in when of Trade Statements.
Hope this helps.

Sola Fide [Strategy]Sola Fide High Accuracy with ATR R:R
Indicators used:
- Stochastic RSI
- Chopiness Index
- RSI
- Ichimoku Cloud
- ATR
Script has been set up in strategy format to give backtesting data.
The strategy has been made for BTC and ETH pairs against USDT on the hourly timerframe
Currently outperforming the Buy and Hold Return on both assets.
This script has been made to make it easier to automate strategies on 3commas
In the settings you will see options for BTC strategy or ETH strategy
Choose the asset you are on, copy your 3commas Bot ID and Email token and paste them into the settings box for eachever asset you are on.
To receive the alerts set up within the strategy, in your alert message box use " {{strategy.order.alert_message}}"
This will then be able to send any orders taken on the tradingview script directly to your long or short bot on 3commas
This strategy is set up with a strict set of rules on the ATR for the Take profits and Losses.
There is a repaint warning because the code uses heikin ashi candles through the security function, the given entry and exit signals do not repaint,
I have been automating this for myself with no errors.
You don't need to use more than 3x leverage...
Past results do not guarentee future results.

RSI Hidden Divergence + Stochastic + 200 EMA @DaviddTechHey Traders,
This is my first strategy of many I hope. Inspired by a strategy I found on YouTube I wanted to see if it would work with a BOT strategy.
The idea is :
## LONG ##
* When the price is above 200 EMA take only LONG positions.
* Look for Bullish hidden divergence.
* Stochastic crossover to find our entry.
## SHORTS ##
* When the price is below 200 EMA take only SHORTpositions.
* Look for Bearish hidden divergence.
* Stochastic crossunder to find our entry.
You can used a fixed percentage, ATR, HH/LL or a FIB level to take profit.
Everything is very visual and can be connected easily to a bot.
I will be doing a video on HOW-TO setup in a couple of days.
## MUTLI LEVEL PROFITS ##
This will show you on backtest is you take profits at 3 levels however I have not tested on a BOT strategy.
NOTE : This is for educational purposes and please test on a paper account, as I said this is my first strategy.
I will be working and back testing new strategies every week.
- Made with ♥ @DaviddTech

Scalper Helper System===========================================================================
===========================================================================
Description
===========================================================================
===========================================================================
Scalper Helper System combines a series of trade strategies which have been learned and honed in the Jim of All Trades channel.
Paixy has contributed candlestick combination rules, Jonas has shared his deep understanding of Stochastic.
Jim himself has taught clearly on the merits of RSI.
This system attempts to formulate all the notes and rules I have made over the past months.
The system searches for 10 - 15 rules which are divided into bullets and bombs. Bombs relate to momentum, so these signals may not be pinpoint accurate, but they are more often leading to bigger moves.
This initial version is released mainly only to the JOAT community to help continue the development of the idea and to help find
continued improvements.
Special thanks to FiendishFeather for his strategy work, (check out his work to learn how to apply any trading strategy to his back testing harness), and the date filtering snippet and the tip to show this option at the top.
===========================================================================
===========================================================================
The strategy decisions are based on the following general rules:
===========================================================================
===========================================================================
BULLETs are hint to the idea of firing a small sized position into the market, BOMBs are hints to go all in - however this does not mean proper risk management should be forgotten.
Without risk management this and any strategy will lead to failure.
Without risk management this and any strategy will lead to failure.
Without risk management this and any strategy will lead to failure.
Without risk management this and any strategy will lead to failure.
===========================================================================
Bullet1 uses the value of the stochastic and checks for buy/sell cross over on 5m, 8m and 13m chart.
These values should be calculated on a ratio basis ideally.
Bullet2 measures divergence between the printed Stochastic signals.
Bullet3 has been decommissioned.
Bullet4 is an RSI divergence and value indicator.
Bullet5 has been decommissioned.
Bullet6 uses the history of the stochastic buy and sell signals
Bullet7 uses the Scalper Helper Trends for entries by attempting to see how the overall trend is changing. More refinement is needed here.
Bullet8 uses the Scalper Helper Trends on multiple timeframes for entries.
Bullet9 strict buy/sell signals from Stochastic RSI
Bomb1 relies on the Fast, Medium and Slow MA's being correctly lined up as well as the Stochastic, this hints at a more imminent move and so the strategy suggests a quicker entry.
Bomb2 relies on the Fast, Medium and Slow MA's NOT being correctly lined up as well as the Stochastic, and therefore has the luxury of suggesting Limit orders near the local high/low.
Bomb3 looks for two or more Stochastics signals in the same direction and then performs a divergence calculation.
Bomb4 looks a change in the Stochastics signals direction and then performs a divergence calculation.
===========================================================================
===========================================================================
Configuration settings:
===========================================================================
===========================================================================
Users can chose to show mainly buy and/or sell signals and can select a level of strictness. Enabling strict rules will force a multi timeframe comparison of Stochastic analysis.
Users can try different levels for long and short targets for profit and stop loss. This is important because the market does not behave the same going up as it does going down.
The RSI conditional check makes the strategy more selective. This discernment can be applied to bullets or bombs in order to validate entry and exits.
During the bull run and perhaps even in ranging markets, the RSI overbought levels is usually 70-80, but in the bear market we are seeing in Crypto now, a value of 60 is more useful. Try for yourself to see what works for you and feedback in the comments.
An additional indicator, Scalper Helper Trends is recommended to get a quick view on the trend condition (rally, base, down) by viewing the MACD from multiple time frames. Further research is required to know which larger timeframes work best here.
For the 15min chart, 15m, 30m, 45m, 60m, 120m, 240m, 360m, 960m would work well. Note it is not possible to go higher than 1000 at this time.
Whether you use the Scalper Helper trends or not for your own visual confirmation, it is possible to allow this indicator to attempt to read it for you. More research is required to best model the reading of this. For now, it will simply measure the gradient of the number of up versus down colors.
The system can also find entries off the Scalper Helper Trends - but really this, by design is not the best use of Scalper Helper Trends. Although you may prove me wrong so the option is given for you to find buy/sells with your own testing.
Users can chose to use some engulfing candle arrangements to trigger exits and define the length of the 200MA and decide if this should play a part in the filtering of the signals. Similarly, a check can be made to ensure that the first two candles after a signal are behaving as we would expect with the "Wait for 2 closing in the direction of the signal" option. This has a lot of value on the 1min chart.
When Revenge trade is set to true you may re-enter a trade in the same direction as the last one when the last one was stopped out, otherwise you would only be looking for trades in the other direction. We all should not revenge trade, and indeed I have only seen a few cases when it has increased the profitability, however this option remains for now.
The flip opens a new trade in the reverse direction when a signal is given to close a trade, but does not apply to scenarios where stop losses or take profit closed the trade.

Maximized Scalping On Trend (by Coinrule)" The trend is your friend. " This is one of the most famous and valuable teachings that experienced traders can give to newbies. There is a reason for that.
No matter your views about where the price moves, what matters is where the price heads to . The market is always right, and ultimately it decides who gets the profit and who has to take a loss.
The purpose of this strategy is to spot when it's the most suitable time to buy an asset profiting from a potential short-term price increase. The strategy tends to open trades frequently, closing them on average in one and a half days.
ENTRY
The buy order is placed on assets that present strong momentum when it's more likely that it is about to increase further in the short term.
To capture momentum on the asset, the rule strategy requires:
the MA50 greater than the MA100
the RSI greater than 50
The rule, then, places the order when
The price crosses above the MA9.
EXIT
This strategy comes with a stop loss and a take profit which adapt dynamically to market conditions.
The trade is closed in profit when the RSI is greater than 70 , as the trend could experience a pull-back.
Alternatively, the trade is closed when the RSI is lower than 30 , being this a sign of weakening of the trend.
Pro tip : The 1-hour time frame has proven to return the best results on average. The strategy can also work well in the 15-min time frame if you want to increase the trades' frequency.
The strategy assumes each order to trade 30% of the available capital and opens a trade at a time. A trading fee of 0.1% is taken into account.

[CADCHF] DinhChienFX's Predict signaltrend: crossing 2 times upper 2/lower 2 - stop/profit: 1/1 - Entry: Upper/lower 1, Entry 2: 0.66 (66%)
HH-HL/LL-LH: 15:15; ADX: 38, smooth: 9, DI: 9.
Order 1: 92 trades - 65.22% - R/R: 1/1
Order 2: 64 trades - 54.02% - R/R - 1/1.94 (fibonacci 66%)
Total 2 order: 156 trades - 59.62% - Net Profit: 201.46% - Max drawdown: 9.02%.
Commission: 4usd/trade
slippage: 2
1. Identify the trend
* On the chart:
a. Part of Dow theory: multi-trades active at the impulse waves.
Uptrend trend:
- HH / Higher High: The following peak is higher than the previous one .
- HL / Higher Low: The back bottom is higher than the previous one .
Downtrend:
- LL / Lower Low: The back bottom is lower than the previous one .
- LH / Lower High: The posterior peak is lower than the previous one
Pivot left: 15
Pivot right: 15
b. Keltner price channel:
- Uptrend: Go above Upper 2 two times
- Downtrend: Down to Lower 2 two times
* Under Chart:
ADX indicator: Used to identify a strong trend
- ADX smooth: 9
- DI: 9
- ADX = 38
2. Entry point:
- Buy: Buy limit at the Upper Keltner channel.
- Sell: Sell limit at the Lower Keltner channel.
3. Take profit, stoploss
ATR indicator (20) ( Average true range ) * 2

Heatmap - Multi-Timeframe Indicators - StrategyHeatmap - Multi-Timeframe Indicators - Strategy
▪ Main features :
- 19 Timeframes: 1m, 3m, 5m, 10m, 15m, 30m, 45m, 1h, 2h, 3h, 4h, 5h, 6h, 8h, 10h, 12h, 1D, 1W, 1M
- 6 indicators per timeframe
- choose specific timeframes for indicators (example - 1 hour)
- or choose specific timeframe ranges (example - 1 hour to 1 month)
The general idea is that the higher timeframe signals are stronger than the lower timeframe ones.
When a trend is starting, it is first visible on the lower timeframes.
The more time passes, the more the trend propagates through higher timeframes.
The default settings are meant to show all the available features. You may fine-tune it to your specific needs.
How to choose the timeframe for the chart : use the lowest of the choosen timeframes for indicators.
If the heatmap doesn't display correctly on your device, you may check the Heatmap Theme 🎨 setting.
It doesn't repaint.
"Repaint" version available though - good to check the past history, but very bad for real-time analysis.
▪ Indicators used for trend detection
1. MACD Cross
2. Stochastic Cross
3. Stochastic Cross and Overbought or Oversold
4. Moving Average
5. Parabolic SAR
6. Heikin Ashi
▪ Find the best Heatmap settings with the Strategy Tester version.
The signals generated by the Heatmap are considered to be valid at the bar open .
The Strategy Tester, however, uses the bar close in its calculations.
Therefore, the results may seem to be worse than they can be.
The Profitability, Profit Factor and other stats should be taken into consideration relatively to other configurations of the same Heatmap.
▪ Using a score system to consider a change in trend valid.
Example: consider the signal valid if 65% or more of all indicators (max 6) among all timeframes (max 19) hint at a change in trend.
The % percent value can be inserted in settings.
When using the default settings or when all timeframes and indicators are activated,
the ratio of 100% downtrend or 100% uptrend may be less occuring. Adjust accordingly.
The signals across timeframes and indicators are aggregated to show simple entry and exit signals.
▪ Combined Alerts, to be set to fire once per bar open :
0 - 📈 Long! - Heatmap - Multi-TFI
0 - 📈 Short! - Heatmap - Multi-TFI
0 - 📈 Long Exit! - Heatmap - Multi-TFI
0 - 📈 Short Exit! - Heatmap - Multi-TFI
1 *** BUY or SELL (single alert) ***
1 *** Entries or Exits (single alert) ***
▪ Note : The initial load may be slow. If something doesn't seem to work, you can try the following:
- wait more time for it to load
- hide & show or remove & add back to chart
- don't add the indicator to chart multiple times in a short amount of time, as you may be rate limited
▪ Related Studies :
- Heatmap - Multi-Timeframe Indicators - Alerts
- Risk Management System (Stop Loss, Take Profit, Trailing Stop Loss, Trailing Take Profit) - it can be connected to Heatmap - Multi-Timeframe Indicators - Alerts
▪ Layout example:

Cyatophilum Strategy BuilderAn indicator to create strategies, backtest and setup alerts.
The user can choose one or multiple TA entry conditions, if more than one the conditions are combined with a logical AND.
The entries will open up a trade, which is then handled by a risk management system including Trailing Stop, Take Profit and up to 100 Safety Orders.
This indicator can be used to backtest 3commas DCA bots who are using TA presets, RSI or ULT.
Its main goal is to create strategies by combining indicators.
Let's dive into the details of what's included:
Entry Condition: MACD
Triggers an entry when macd crosses with the signal line.
Configure the fast, slow length, signal smoothing and timeframe to trigger the condition.
Entry Condition: RSI
Triggers an entry when the RSI is higher or lower than the long/short threshold.
Configure the length, timeframe, long and short threshold to trigger the condition.
Entry Condition: ULT (Ultimate Oscillator)
Triggers an entry when the ULT is higher or lower than the long/short threshold.
Configure the 3 lengths, timeframe, long and short threshold to trigger the condition.
Entry Condition: Bollinger Bands
Triggers an entry when the price is above the upper band for long and below the lower band for short.
Configure the length, standard deviation and timeframe to trigger the condition.
Entry Condition: MFI (Money Flow Index)
Similar to RSI, it triggers an entry when the MFI is higher or lower than the long/short threshold.
Configure the length, timeframe, long and short threshold to trigger the condition.
Entry Condition: CCI (Commodity Channel Index)
Another oscillator that triggers an entry when its value is higher or lower than the long/short threshold.
Configure the length, timeframe, long and short threshold to trigger the condition.
Trend Filters
Use one or two trendlines to filter your trades: go only long/short when the trendline is bullish/bearish.
Choose between the several trendlines: ema, sma, wma, hull ma, kama, alma, rma, swma, vwma, Tilson T3, and the unique Adaptive T3 and Adaptive Hull MA.
If this is not enough, you can use the external trendline feature to plug in any other indicator for your trendline.
The second trendline can be MTF and come from another symbol if needed.
Combining Indicators
Most of the time we will not be using a single indicator at a time, but instead, combine them in order to get stronger entries.
The entry conditions are combined using a AND logical gate, meaning all conditions must be true for the entry to trigger.
Here is an example using a combination of 2 indicators: Bollinger Bands and RSI.
We can see less entries are being triggered on the bottom chart than on the top chart because the bottom chart is combining the 2 indicators while the top chart is only using Bollinger Bands.
You can combine up to all 6 indicators if you want, but keep in mind that combining too many may lead to triggering no entry at all.
Risk Management and Trade system
The indicator will not trigger more than one long or short entry in a row.
To start a new trade, the indicator will wait for either take profit, stop loss or an opposite entry if no SL and TP is set.
Stop Loss and Take Profit
Configure your stop loss and take profit for long and short trades.
You can also make a trailing stoploss and a trailing take profit.
Safety Orders
Just like 3commas bots, you can create a strategy with up to 100 safety orders.
Configure their placement and order size using the price deviation, step scale, take profit type (from base order or total volume), and volume scale settings.
Note: only the 20 first safety order steps or so will be plotted due to graphic limiations. The steps after that still trigger alerts and backtest results.
Creating Alerts
The indicator is using the newest alert system:
1. Write your alert messages in the indicator settings (alert section at the bottom)
2. Click "Create Alert" as usual, but choose "alert() function calls only"
Data Window
Since the indicator is applied on top of the price chart, the oscillator indicators cannot be plotted. You can always add them on another pane but if you want to just see their values, you can use the Data Window to see the value of each oscillator on each bar.
Backtest settings
Used to get the results below:
Initial Capital: 100 000$
Base Order Size: 0.1 contract (BTC)
Safety Order Size: 0.1 contract (BTC)
Commission: 0.1%
Slippage: 100 ticks
pyramiding: 6
The indicator settings are plotted in the main chart panel.

Ultimate Strategy TemplateHello Traders
As most of you know, I'm a member of the PineCoders community and I sometimes take freelance pine coding jobs for TradingView users.
Off the top of my head, users often want to:
- convert an indicator into a strategy, so as to get the backtesting statistics from TradingView
- add alerts to their indicator/strategy
- develop a generic strategy template which can be plugged into (almost) any indicator
My gift for the community today is my Ultimate Strategy Template
Step 1: Create your connector
Adapt your indicator with only 2 lines of code and then connect it to this strategy template.
For doing so:
1) Find in your indicator where are the conditions printing the long/buy and short/sell signals.
2) Create an additional plot as below
I'm giving an example with a Two moving averages cross.
Please replicate the same methodology for your indicator wether it's a MACD, ZigZag, Pivots, higher-highs, lower-lows or whatever indicator with clear buy and sell conditions
//@version=4
study(title='Moving Average Cross', shorttitle='Moving Average Cross', overlay=true, precision=6, max_labels_count=500, max_lines_count=500)
type_ma1 = input(title="MA1 type", defval="SMA", options= )
length_ma1 = input(10, title = " MA1 length", type=input.integer)
type_ma2 = input(title="MA2 type", defval="SMA", options= )
length_ma2 = input(100, title = " MA2 length", type=input.integer)
// MA
f_ma(smoothing, src, length) =>
iff(smoothing == "RMA", rma(src, length),
iff(smoothing == "SMA", sma(src, length),
iff(smoothing == "EMA", ema(src, length), src)))
MA1 = f_ma(type_ma1, close, length_ma1)
MA2 = f_ma(type_ma2, close, length_ma2)
// buy and sell conditions
buy = crossover(MA1, MA2)
sell = crossunder(MA1, MA2)
plot(MA1, color=color_ma1, title="Plot MA1", linewidth=3)
plot(MA2, color=color_ma2, title="Plot MA2", linewidth=3)
plotshape(buy, title='LONG SIGNAL', style=shape.circle, location=location.belowbar, color=color_ma1, size=size.normal)
plotshape(sell, title='SHORT SIGNAL', style=shape.circle, location=location.abovebar, color=color_ma2, size=size.normal)
/////////////////////////// SIGNAL FOR STRATEGY /////////////////////////
Signal = buy ? 1 : sell ? -1 : 0
plot(Signal, title="🔌Connector🔌", transp=100)
Basically, I identified my buy, sell conditions in the code and added this at the bottom of my indicator code
Signal = buy ? 1 : sell ? -1 : 0
plot(Signal, title="🔌Connector🔌", transp=100)
Important Notes
🔥 The Strategy Template expects the value to be exactly 1 for the bullish signal , and -1 for the bearish signal
Now you can connect your indicator to the Strategy Template using the method below or that one
Step 2: Connect the connector
1) Add your updated indicator to a TradingView chart
2) Add the Strategy Template as well to the SAME chart
3) Open the Strategy Template settings and in the Data Source field select your 🔌Connector🔌 (which comes from your indicator)
From then, you should start seeing the signals and plenty of other stuff on your chart
🔥 Note that whenever you'll update your indicator values, the strategy statistics and visual on your chart will update in real-time
Settings
- Color Candles : Color the candles based on the trade state (bullish, bearish, neutral)
- Close positions at market at the end of each session : useful for everything but cryptocurrencies
- Session time ranges : Take the signals from a starting time to an ending time
- Close Direction : Choose to close only the longs, shorts, or both
- Date Filter : Take the signals from a starting date to an ending date
- Set the maximum losing streak length with an input
- Set the maximum winning streak length with an input
- Set the maximum consecutive days with a loss
- Set the maximum drawdown (in % of strategy equity)
- Set the maximum intraday loss in percentage
- Limit the number of trades per day
- Limit the number of trades per week
- Stop-loss: None or Percentage or Trailing Stop Percentage or ATR
- Take-Profit: None or Percentage or ATR
- Risk-Reward based on ATR multiple for the Stop-Loss and Take-Profit
This script is open-source so feel free to use it, and optimize it as you want
Alerts
Maybe you didn't know it but alerts are available on strategy scripts.
I added them in this template - that's cool because:
- if you don't know how to code, now you can connect your indicator and get alerts
- you have now a cool template showing you how to create alerts for strategy scripts
Source: www.tradingview.com
I hope you'll like it, use it, optimize it and most importantly....make some optimizations to your indicators thanks to this Strategy template
Special Thanks
Special thanks to @JosKodify as I borrowed a few risk management snippets from his website: kodify.net
Additional features
I thought of plenty of extra filters that I'll add later on this week on this strategy template
Best
Dave

JFRewards Indi Channel <Heikin> v4.0<>
SOP guidelines only given to JF members .
The ideas are:
1) Finding where to enter position of buying and sell.
2) Finding where is the realistic take profit target within 24 hours with maximum profits.
3) Finding Trailing STOP LOSS, Trailing Take Profit, Take Profit, STOP LOSS.
Fully tested with @Binance Exchanger with numerous of stablecoins and altcoins as well as BTC , ETH.
Performance cannot be shown due to non standard chart of Heikin Ashi.

Pyramiding Entries On Early Trends (by Coinrule)Pyramiding the entries in a trading strategy may be risky but at the same time very profitable with a proper risk management approach. This strategy seeks to spot early signs of uptrends and increase the position's size while the right conditions persist.
Each trade comes with its stop-loss and take-profit to enforce a proportional risk/reward profile.
The strategy uses a mix of Moving Average based setups to define the buy-signal.
The Moving Average (200) is above the Moving Average (100), which prevents from buying when the uptrend is already in its late stages
The Moving Average (9) is above the Moving Average (100), indicating that the coin is not in a downtrend.
The price crossing above the Moving Average (9) confirms the potential upside used to fire the buy order.
Each entry comes with a stop-loss and a take-profit in a ratio of 1-to-1. After over 400 backtests, we opted for a 3% TP and 3% SL, which provides the best results.
The strategy is optimized on a 1-hour time frame.
The Advantages of this strategy are:
It offers the possibility of adjusting the size of the position proportionally to the confidence in the possibilities that an uptrend will eventually form.
Low drawdowns. On average, the percentage of trades in profit is above 60%, and the stop-loss equal to the take-profit reduces the overall risk.
This strategy returned good returns both with trading pairs with Fiat/stable coins and with BTC. Considering the mixed trends that cryptocurrencies experienced during 2020 vs BTC, this strengthens the strategy's reliability.
The strategy assumes each order to trade 20% of the available capital and pyramids the entries up to 7 times.
A trading fee of 0.1% is taken into account. The fee is aligned to the base fee applied on Binance, which is the largest cryptocurrency exchange.

Gregoire Channel StrategyAdd the strategy to the chart, and start by selecting one of four systems:
1) Trend Following
2) Trend Following - Long Only
3) Volatility Breakout
4) Volatility Breakout - Long Only
Each system is better suited to a particular type of market. Find out through back-testing which system and timeframe is best for each market.
Trend Following is good for securities that strongly trend up and down. Examples: Bitcoin, "growth" stocks.
Trend Following (Long Only) is great for stock indexes that are on a 100 year uptrend, or US-based crypto exchanges which don't allow margin trading but you want to catch the big trends (BTC, ETH).
Volatility Breakout is a defensive system designed to capture the meat of the move and protect the gains. This system is better for altcoins and mature markets like forex pairs.
Volatility Breakout (Long Only) is for US-based crypto exchanges that don't allow margin trading. Good for altcoins.
DEFAULT SETTINGS:
START DATE: 1/1/2020
FEE: 0.1% (This is the Binance.us fee per trade, tailor it to your exchange)
TAKE PROFIT GCW: 0
STOP LOSS GCW: 0
LENGTH: 20
SOURCE: HL2
The system doesn't need stop losses or take profit levels as they are built into the system, but you can add them if you want. 1 GCW = half the channel, so the distance from the top of the channel to the middle line. 2 GCW = the height of the channel.
MISC
-Make sure you calculate the fees! They make a huge difference in profitability. For example, test how Coinbase.com's fees of 0.5% compared to Binance.us's fees of 0.1%. It's huge!
-Try different sets of lengths and timeframes. For example, I like using the daily timeframe and low length for stocks and intraday timeframe with long lengths for crypto. See what tests best!
Disclaimer: past performance doesn't equal future results, this isn't financial advice, this is for entertainment purposes only, consult a professional financial advisor.

DMT 369 DRAGRONFLY STRATSuccessful traders trade with a fixed plan and without emotion, but this a lot harder than many new traders think. Many never master this skill and suffer continual drawdowns on their accounts as they overtrade high leverage positions in volatile markets.
ĐΜŦ Autobot resolves this issue by taking the human element out of the equation, allowing full automation of trades using TradingView alerts to trigger your favourite trading bot, such as Alertatron or 3Commas.
Being a Trend Reversal Indicator based on Volatility & Average True Range, ĐΜŦ Autobot is designed to identify spots in the market that offer suitable scalp and swing trade opportunities.
Due to popular demand we have expanded our ĐΜŦ Autobot product line to include the new ĐΜŦ Autobot Dragonfly 3-6-9 Edition which combines DMT with 3-6-9 Vortex mathematics, our Titan indicator and a multi-ladder scalping strategy to ensure you maintain a preferable average entry when price action moves against your position.
Indicator View
It its default state the DMT Autobot Dragonfly indicator displays key signal information, such as:
• Support & resistance range lines
• Titan Body Small & Large Time Frame lines
• Long & Short entry positions
• Long & Short position ladders
• Profit targets
Dragonfly displays a range between resistance (upper line) and support (lower line) on the chart.
Once the price is granted support in the range the lower line will turn green. As price action develops it will make repeated attempts to test support. If support holds price will attempt to test the resistance line (red).
When resistance is broken and the price is above the upper line, the line will turn blue confirming the bullish momentum and provide a potential buy opportunity.
Price action will make attempts to test the upper line as support and will keep rising while support is granted.
Once support is lost the upper line will become red once more. As price action develops it will make repeated attempts to test resistance. If resistance holds, the price will attempt to test the support line (green).
When support is broken and the price goes below the lower line, the line will turn red confirming the bearish momentum and provide a potential selling opportunity.
Price action will make attempts to test the lower line as resistance and will keep dropping while resistance is granted.
Titan Body
The Titan Body Small & Large time frame options in the indicator add additional trendlines to the chart to provide further clarity and confirmation to the Support & Resistance range indication.
Once price is granted support by the Small Time Frame trend line the line will turn green. As price action develops it will make repeated attempts to test the Small Time Frame support. Once the price is below the Small Time Frame trend line, the line will turn red and can act as resistance in a trend reversal.
When price is granted support by the Large Time Frame trend line the line will turn cyan. As price action develops it will make repeated attempts to test the Large Time Frame support. Once the price is below the Large Time Frame trend line, the line will turn orange and can act as resistance in a trend reversal.
The Titan Body enabled and customized in the indicator’s style settings,
Alert indicators
DMT Autobot Dragonfly Edition generates signals that can be used to scalp trade a volatile asset.
Signals are enabled and customized in the indicator’s input settings Additional options can be found in the options, but it is recommended that these are left at the default, as shown below. The indicator generates many
Entry and Profit levels can be disabled or customized in the indicator’s style settings,
Tradingview Alerts
Using Tradingview alerts, DMT Autobot Dragonfly signals can be used to trigger a trading bot.
To trigger a long or short position, set the Tradingview Alert Condition to DMT 369 Dragonfly and select the long or short option.
It is recommended that long or short positions are configured to trigger Once Per Bar Close
Ladders can also be triggered using alerts. To trigger a ladder order, set the Tradingview Alert Condition to DMT 369 Dragonfly and select the appropriate Long or Short ADD option that is to be triggered by the relevant values defined in the indicator’s configuration.
It is recommended that ladder orders are configured to trigger Once Per Bar,
To trigger a take profit order, set the Tradingview Alert Condition to DMT 369 Dragonfly and select the Long or Short TP option that is to be triggered by the relevant values defined in the indicator’s configuration.
Take profit orders can be configured as Once Per Bar Close or Once Per Minute.
If you wish to trigger a take profit signal immediately when the indicator’s defined take profit value is achieved, then use the Once Per Bar option.
Selecting Once Per Bar Close to generate a take profit signal is a gamble as the candle may close far away from the defined profit target – positive or negative.
While stops can be used, they are not applicable to the recommended ladder strategy.
Ladder Strategy
The DMT Autobot Dragonfly indicator always turns an underwater position into a win by utilizing a ladder strategy.
By using the recommended defaults, the indicator will trigger ladder orders at 3%, 6% & 9% using increasing order sizes,
Order sizes increase exponentially to ensure a good average price is maintained. If you are not using DMT Autobot Dragonfly signals to trigger ladder or take profit orders, please ensure your trading bot is configured to recalculate the new ladder entry and profit target based on the new average position entry price as each ladder is filled.
If you are using DMT Autobot Dragonfly on a leveraged asset, please ensure the leverage position is configured suitably so that your position is not liquidated if the price rapidly moves against you.
If u are looking for more information or access to the script please private msg me in trading view chat thx for support

Ultimate multi-indicator strategy and script- AlphaNHBI created this to be the best multi-indicator strategy, with a matching alert script. This script is ideal for beginners, as well experienced traders who need direct indicators without any of the flashy unnecessary features. This script gets right to the point.
This strategy code was designed for the best mixture of most common indicators, allowing the user to mix and match any indicator he/she chooses. You are able to use sell signals that are either take profits and sell signals, or you are able to use the sell signals of one, or more indicators, OR you can use both (sell signals of indicators AND take profits and stop losses.)
Buying indicators allow you to use the MACD , stochastics, RSI , moving average, fibonacci, t3, Bollinger bands , fractals, and more.
This script works on anything with a chart. It can be applied to crypto, stocks, bonds, forex, etc.
If you would like the script that matches this strategy so that you can do REAL TRADING with LIVE TIME ALERTS, please DM me.
If anyone has suggestions on how to make this better, let me know! This is a growing script that I am building to be universally solid through different markets and through different market conditions!
The details of this backtest are the following:
Initial Capital: 5000
Order Size: 25%
Pyramiding: 10 (although, I don't usually use pyramiding myself, and you don't need to and you will still be largely profitable, by pyramiding definitely helps with smoothing results.)
Commission: 0.1% to match Binance fees

Cyatophilum Scalper [BACKTEST]This indicator comes with a backtest and alert version. This is the backtest version. Its purpose is to create low timeframe and scalping strategies, by choosing from a list of built-in entry points which are described in detail below, and by configuring a risk management system to your liking.
Before diving into the entry points, I will explain the strategy and risk management settings.
These 3 settings allow to choose your strategy direction, and main behavior.
- Go Long ↗: activate or deactivate long entry points.
- Go Short ↘: activate or deactivate short entry points.
- Reversal strategy ↗↘↗↘: Activate this option will allow trades to reverse position from an opposite entry point. Keep it deactivated and trades will either wait a TakeProfit(TP) or StopLoss(SL) to be closed. When neither SL nor TP or set, this option is automatically activated.
StopLoss settings:
Both Long and Short SL can be activated and configured.
The base % price is the starting point of the stoploss, in a percentage of current price.
Trailing stop, when activated, works with 2 settings:
- % Price to Trigger: a percentage of current price the price should move in a bar to trigger a trailing movement.
- % Price Movement: the stoploss variation in a percentage of current price that moves on each bar.
TakeProfit settings:
Both Long and Short TP can be activated and configured.
The base % price is the value of the TP, in a percentage of current price.
Trailing Profit Deviation %: Percent deviation for the trailing take profit.
DCA:
DCA stands for Dollar Cost Average. The idea is to open additional orders from the base order so as to improve risk management.
These additional orders are also called Safety Orders. The indicator can handle up to 9 safety orders.
The strategy will exit either from a take profit based on percentage from base order or from a total volume percentage (Configurable in the parameters).
The steps spacing (space between each step) and safety orders volume (order size) can both scale by adding a scale multiplier.
By choosing from the base strategy dropdown menu, the indicator will generate entry points.
1. BUY SELL:
-> Low timeframes spot trading, with simple buy and sell orders.
How it works:
The indicator used is a combination of QQE (Atr based trend following indicator) and RMA 100 trendline.
I think the QQE does a great job in low timeframes because it is not impacted by the noise.
The RMA which is the moving average used in the RSI, will help giving confirmation to the entry points.
How to use:
It is meant to be used as a reversal strategy, but you can add a TP or SL if you want.
When comparing to Buy & Hold, make sure to deactivate the "Short results in the backtest" setting.
2. TREND SCALPING
-> A strategy for low timeframes trading.
How it works:
The strategy creates high volatility entries filtered by a duo convergence of adaptive trendlines (Adaptive HULL MA using the chart's resolution, Adaptive Tilson T3 using 1H resolution) and a higher timeframe (1H) RSI filter (long threshold: 70, short threshold: 40, RSI length: 10).
How to use:
Must be used on charts with a resolution smaller than 1H. Recommended: from 1m to 30m.
Must NOT be used as reversal strategy. Use it with a take profit and stop loss, and DCA if you can.
Sample risk management settings:
3. Support/Resistance BREAKOUTS
-> Trade low timeframes pivot points breakouts.
How it works:
The indicator calculates the 100 previous bars swing high and low. Any break above high or below low will trigger an entry point.
The entry is however filtered by an Adaptive Tilson T3 Trendline, an ADX 30 minimum threshold and a minimum average volume threshold.
How to use:
I recommend to click "Reversal" Strategy and set a Takeprofit target.
Find the best timeframe between 1m and 30m using the backtest version.
Example here with BTCUSDTPERP on 15m:
4. AGGRESSIVE SCALPING
-> Lots of trades in low timeframes.
How it works:
Created using Cyato AI, Higher/Lower Highs and Lows and 2 HULLMA crosses as entries, and 2 Adaptive Tilson T3 as trendfilter, a 25 ADX threshold filter and a volume filter.
How to use:
Recommended Risk Management settings: Takeprofit, Stoploss and DCA (Safety orders).
Find which timeframe work the best from 30 min and below. Should not be used above 30 min since this is the resolution for the MTF Tilson.
How to create Strategy Alerts:
Write your alert messages for EXIT, LONG and SHORT orders in the settings (Backtest section).
Then click add alert, and in the alert message, write the following:
{{strategy.order.alert_message}}
BACKTEST PARAMETERS
- Inital capital: 10 000$
- Base order size: 0.1 contract (0.1 btc)
- Safety order size: 0.1 contract (0.1 btc)
- Commission: 0.1%
- Slippage: 100 ticks
Oldest trade: 2020-08-31
Backtest Period: From 2020-08-31 to 2020-11-12
Configuration used: see the live chart configuration panel at the top.
To gain access to this paid indicator, please use the link below.

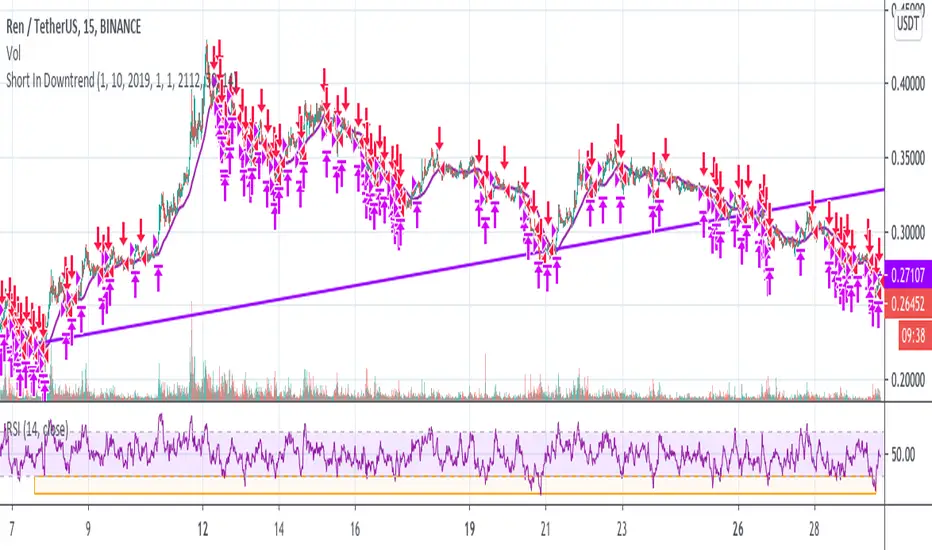
Short In Downtrend Below MA100 (Coinrule)This is a simple strategy to take advantage of downtrends. It's useful to run such a strategy as a hedge in times of market uncertainty.
The Sell Condition - Entry
The sell signal triggers when:
the coin has MA (100) greater than the price in a timeframe of 15 minutes, meaning that the coin is in a short-term downtrend.
the coin has an RSI greater than 30 in a timeframe of 15 minutes, indicating that it didn't reach oversold conditions yet, so there is still room for a further price drop.
On Coinrule, you can launch the strategy on real market conditions, setting up multiple sequential sell orders. The strategy would keep selling while the price stays below the MA(100). In that case, it's advisable to set low amounts for the sell orders. the position will grow gradually while the downtrend intensifies. Set a minimum time interval between the sell orders will also help to have control over the overall position size.
The Buy Condition - Exit
The bot connects to each trade a stop loss and a take profit. The percentages are optimized for short term trades on mid-cap coins. You can adjust the percentages depending on the specific coin you are trading. A ratio of 1:1.5 between the stop loss and the take profit could work as the strategy trades in the same direction of the trend.
Stop loss at 3% from the entry price
Take profit at 2% from the entry price
A slightly larger stop loss allows tolerating more volatility to reduce the case of stops triggering when it shouldn't.
[astropark] DMI/ADX strategy [strategy]Dear Followers,
today I'm happy to share with you my DMI / ADX Strategy .
It provides directional trend information, so if a bullish or a bearish trend is going to start. Statistically it works better on lower timeframes (from 5 minutes to 1 hour).
It is both a Swing and Scalping Strategy indicator , based on a simple trend following theory , good for trading FOREX, Indexes, Stocks, Commodities and Cryptocurrencies.
To help in Taking Profits, the strategy integrates 2 special other than bull/bear signals:
Overbought and Oversold RSI Signals , which appear both as darker background (the darker the color, the more the price is in overbought/oversold) and green "ob"-"tp" / red "os"-"tp" labels (they optionally pop up only on a configurable stronger overbought/oversold condition) (you can enable/disable it optionally)
Peak Profit Tracker , which resets every time a new trade starts and keeps track of price fluctuation during the trade: the message is don't be too greedy and take profits or lock them with a stoploss in profit (you can enable/disable it optionally)
You can edit many options in order to
have more/less bull/bear signals
enable/disable showing bull/bear signals
enable/disable showing RSI TP signals (you can edit RSI length, overbought (OB) and oversold (OS) levels)
enable/disable showing peak profits on each trade
The user who wants to use this strategy, especially via an automated bot, must always set a stoploss (example 150$ from entry on bitcoin ) or use a proper risk management strategy .
This is not the "Holy Grail", so use it with caution. It's highly suggested to use a proper money management .
This script will let you backtest performance of the indicator based on bear/bull signals.
You can find the alarms version by searching for my DMI / ADX Strategy and choosing the "alarms" named.
Here there are some examples how this DMI / ADX strategy works on many markets:
LTC/USDT 15m
BTC/USD 15m
BNB/BTC 15m
ETH/USD 15m
GOLD (XAU/USD) 15m
GOLD (XAU/USD) 1h
FB 15m
AAPL 15m
TSLA 1h
BANKNIFTY Index 5m
NIFTY 50 Index 5m
This is a premium indicator , so send me a private message in order to get access to this script .

Engulfing strategy with DMI confirmationThe strategy contains Bearish and Bullish Engulfing trend reverse alerts with entry and closure notifications. Entries are enforced by Directional Movement Index (DMI) indicator levels combination. The strategy can be applied to spot, futures and marginal trading exchanges. It is suitable for both long and short positions and works accurately with BTC, USDT, ETH and BNB quote currencies. Best to use with 1H timeframe charts
Strategy elements can be configured at your own desire with user interface settings, no programming skills required:
1. Choose signals type: Long, Short or Both
2. Choose trend detection pattern rule:
SMA50 - provides a higher number of positions
SMA50 + SMA200 provides a higher accuracy
3. Change risk management settings to make the most accurate and efficient configuration. You can set up unique stop loss, take profit and trailing offset for different assets
4. Configure strategy periods
DMI and ADX lengths
ADX Smoothing
Key level
EMA and SMA lengths
5. Configure backtest dates
6. Show or hide RSI support and resistance bands
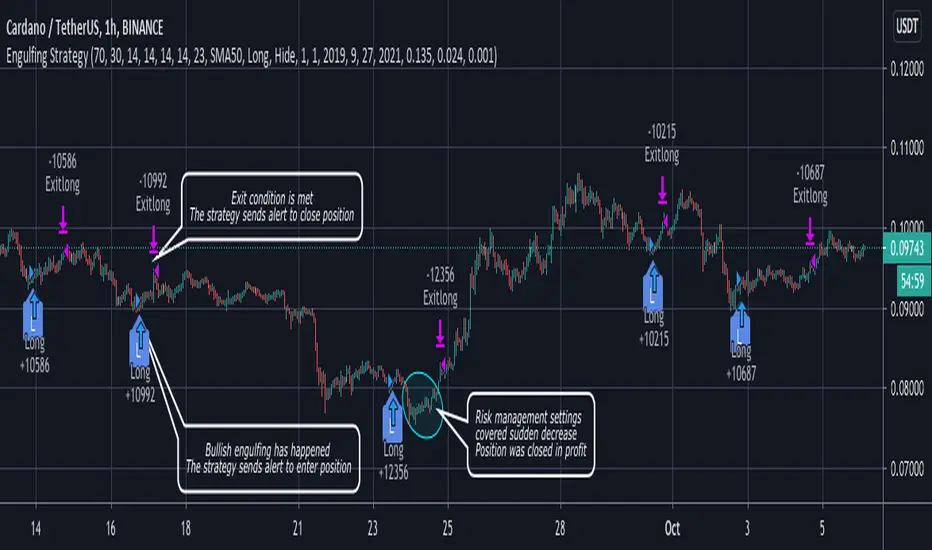
Engulfing strategy provides information for traders to enter the market in anticipation of a possible reversal in trend. Engulfing candles tend to signal a reversal of the current trend in the market. This specific pattern involves two candles with the latter candle "engulfing" the entire body of the candle before it. The engulfing candle can be bullish or bearish depending on where it forms in relation to the existing trend. The script calculates and compares values of the price action candles to define is there an engulfing and what type it is: bullish or bearish
If there is a bullish engulfing the indicator fills price action candle with yellow color
If there is a bearish engulfing the indicator fills price action candle with purple color
Advantages of the script:
1. The script detects presence of both types of engulfing: Bullish and Bearish
2. Weak engulfment signals and market noises are filtered by RSI bands and DMI confirmations. This allows to receive only strong and confirmed engulfment signals
3. This script has configurable risk management settings (order size, commission, take profit, stop loss and trailing). This provides you opportunity of direct broker connection and allows to conduct backtests before applying the strategy to real account. You also can set up strategy actions alerts
At the chart you can see the historical price action of ADAUSDT at Binance exchange from the January 1st 2019 till current date. The strategy is set up to receive only long signals because it is a spot market. Moments when the strategy triggered to enter a position are shown as L label while position entries are shown as "Long" messages. Moments when a certain position should be closed are shown as "Exitlong" messages
The strategy demonstrate high backtest results:
Mathematical expectation of risk management settings is positive = 1.34%
Percent profitable = 93.33%
Profit factor = 3.253
Quantity of entries = 75
Net profit = 15.22%
How to use?
Long signals:
1. Apply indicator to a trading pair your are interested in.
2. Click Settings button and select Alert Positions Type Long
3. Once bullish engulfing and confirmation conditions are met price action candle will be colored yellow and script strategy will enter a position.
4. Check Strategy Tester to set up optimal Risk management settings: stop loss, trailing profit activation point, trailing offset
5. Set up the strategy alert to be notified when a position should be opened or closed
Short signals:
1. Apply indicator to a trading pair your are interested in.
2. Click Settings button and select Alert Positions Type Short
3. Once bearish engulfing and confirmation conditions are met price action candle will be colored purple and script strategy will enter a position.
4. Check Strategy Tester to set up optimal Risk management settings: stop loss, trailing profit activation point, trailing offset
5. Set up the strategy alert to be notified when a position should be opened or closed
Best regards,
SkyRock Signals team
If you want to receive access to the strategy please contact us in personal message!
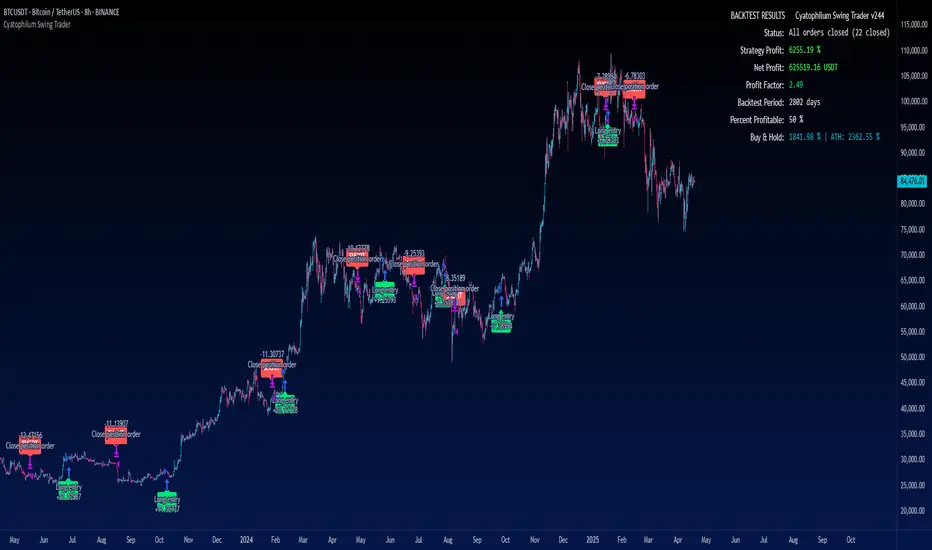
Cyatophilum Swing Trader [BACKTEST]This is an indicator for swing trading which allows you to build your own strategies, backtest and alert. This version is the backtest which allows to use the Strategy Tester. The alert version can be found in my profile scripts page.
The particularity of this indicator is that it contains several indicators, including a custom one, that you can choose in a drop down list, as well as a trailing stop loss and take profit system.
The current indicators are :
CYATO AI: a custom indicator inspired by Donchian Channels that will catch each big trend and important reversal points .
The indicator has two major "bands" or channels and two minor bands. The major bands are bigger and are always displayed.
When price reaches a major band, acting as a support/resistance, it will either bounce on it or break through it. This is how "tops" and "bottoms", and breakouts are caught.
The minor bands are used to catch smaller moves inside the major bands. A combination of volume, momentum and price action is used to calculate the signals.
Advantages of this indicator: it should catch top and bottoms better than other swing trade indicators.
Cons of this indicator: Some minor moves might be ignored. Sometimes the script will catch a fakeout due to the Bands design.
Best timeframes to use it : 2H~4H
Sample:
Other indicators available:
SARMA: A combination of Parabolic Stop and Reverse and Exponential Moving Average (20 and 40) .
SAR: Regular Parabolic Stop and Reverse .
QQE: An indicator based on Quantitative Qualitative Estimation .
SUPERTREND: A reversal indicator based on Average True Range .
CHANNELS: The classic Donchian Channels .
More indicators might be added in the future.
About the signals: each entry (long & short) is calculated at bar close to avoid repainting. Exits (SL & TP) can either be intra-bar or at bar close using the Exit alert type parameter.
STOP LOSS SYSTEM
The base indicators listed above can be used with or without TP/SL.
TP and SL can be both turned on and off and configured for both directions.
The system can be configured with 3 parameters as follows:
Stop Loss Base % Price: Starting Value for LONG/SHORT stop loss
Trailing Stop % Price to Trigger First parameter related to the trailing stop loss. Percentage of price movement in the right direction required to make the stop loss line move.
Trailing Stop % Price Movement: Second parameter related to the trailing stop loss. Percentage for the stop loss trailing movement.
Another option is the "Reverse order on Stop Loss". Use this if you want the strategy to trigger a reverse order when a stop loss is hit.
TAKE PROFIT SYSTEM
The system can be configured with 2 parameters as follows:
Take Profit %: Take profit value in percentage of price.
Trailing Profit Deviation %: Percent deviation for the trailing take profit.
Combining indicators and Take Profit/Stop Loss
One thing to note is that if a reversal signal triggers during a trade, the trade will be closed before SL or TP is reached.
Indeed, the base indicators are reversal indicators, they will trigger long/short signals to follow the trend.
It is possible to use a takeprofit without stop loss, like in this example, knowing that the signal will reverse if the trade goes badly.
The base indicators settings can be changed in the "Advanced Parameters" section.
Configuration used for this snapshot:
BACKTEST SETTINGS
· Initial Capital: 10 000 $
· Order Size: 10% equity (to avoid compounding effect)
· Commission : 0.1% per order (total commission paid: 244.41 €)
· Slippage: 5 ticks
Oldest trade: 2014-04-01
Backtest Period: From 2014-04-01 to 2020-09-04
Use the link below to obtain access to this indicator.
T3-CCI Strategy [SystemAlpha]This is a strategy based on FX Sniper's T3-CCI indicator. Instead of using just the normal buy and sell signal, we added an option to use trend filters, trailing stop loss and take profit targets.
In this strategy you have a choice of:
Trend Filters:
- Average Directional Index ( ADX ) – buy when price is trend is up and sell when trend is down.
- Moving Average (MA) – buy when price close above the defined moving average and sell when price close below moving average
- Parabolic SAR – buy when SAR is above price is above price and sell when SAR is below price.
- All - Use ADX , MA and SAR as filters
For MA Filter , you can use the “TF MA Type” and "TF MA Period" parameter to select Simple or Exponential Moving Average and length.
Stop Loss:
- Average True Range (ATR) – ATR % stop as trailing stop loss.
- Parabolic SAR ( SAR ) – Parabolic SAR adapted as trailing stop loss.
For ATR , you can use the “ATR Trailing Stop Multiplier” parameter to set an initial offset for trailing stop loss.
Take Profit Target:
- Average True Range (ATR) – ATR % stop as trailing stop loss.
- Standard % – Percent as target profit
For ATR , you can use the “ATR Take Profit Multiplier” parameter to set an initial offset for trailing stop loss.
Additional feature include:
- Show Bar Colors
STRATEGY ONLY:
- Set back test date range
- Set trade direction - Long, Short or Both
- Use timed exit - Select method and bars
- Method 1: Exit after specified number of bars.
- Method 2: Exit after specified number of bars, ONLY if position is currently profitable.
- Method 3: Exit after specified number of bars, ONLY if position is currently losing.
TradingView Links:
Alerts:
T3-CCI Indicator:
Advance ADX:
How to use:
1. Apply the script by browsing through Indicators --> Invite-Only scripts and select the indicator
2. Once loaded, click the gear (settings) button to select/adjust the parameters based on your preference.
3. Wait for the next BUY or SELL signal to enter the trade!
Disclaimer:
The indicator and signals generated do not constitute investment advice; are provided solely for informational purposes and therefore is not an offer to buy or sell a security; are not warranted to be correct, complete or accurate; and are subject to change without notice.

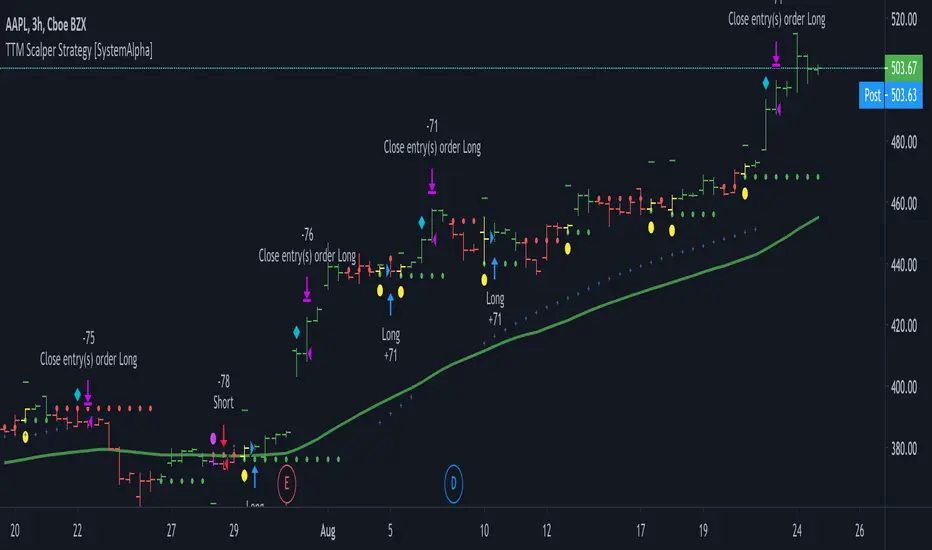
TTM Scalper Strategy [SystemAlpha]This is a strategy based on TTM scalper indicator. Instead of using just the normal buy and sell signal, we added an option to use trend filters, trailing stop loss and take profit targets.
The TTM scalper indicator of John Carter’s Scalper Buys and Sells was originally created by HPotter and is as a close approximation of the one described in his book Mastering the Trade.
In this study you have a choice of:
Trend Filters:
- Average Directional Index ( ADX ) – buy when price is trend is up and sell when trend is down.
- Moving Average (MA) – buy when price close above the defined moving average and sell when price close below moving average
- Parabolic SAR – buy when SAR is above price is above price and sell when SAR is below price.
- All - Use ADX , MA and SAR as filters
For MA Filter , you can use the “TF MA Type” and "TF MA Period" parameter to select Simple or Exponential Moving Average and length.
Stop Loss:
- Average True Range (ATR) – ATR % stop as trailing stop loss.
- Parabolic SAR ( SAR ) – Parabolic SAR adapted as trailing stop loss.
For ATR , you can use the “ATR Trailing Stop Multiplier” parameter to set an initial offset for trailing stop loss.
Take Profit Target:
- Average True Range (ATR) – ATR % stop as trailing stop loss.
- Standard % – Percent as target profit
For ATR , you can use the “ATR Take Profit Multiplier” parameter to set an initial offset for trailing stop loss.
Additional feature include:
- Show Bar Colors
STRATEGY ONLY:
- Set back test date range
- Set trade direction - Long, Short or Both
- Use timed exit - Select method and bars
- Method 1: Exit after specified number of bars.
- Method 2: Exit after specified number of bars, ONLY if position is currently profitable.
- Method 3: Exit after specified number of bars, ONLY if position is currently losing.
TradingView Links:
Alerts:
How to use:
1. Apply the script by browsing through Indicators --> Invite-Only scripts and select the indicator
2. Once loaded, click the gear (settings) button to select/adjust the parameters based on your preference.
3. Wait for the next BUY or SELL signal to enter the trade!
Disclaimer:
The indicator and signals generated do not constitute investment advice; are provided solely for informational purposes and therefore is not an offer to buy or sell a security; are not warranted to be correct, complete or accurate; and are subject to change without notice.